Inventory preparation & data analysis
Spotting differences before they become an inventory problem.
Part of inventory preparation begins long before the actual inventory day. In the high zones, stores record stock in advance, while other areas are only counted on inventory day itself.
That raised a decisive question for me: how can you tell during this pre-count whether the recorded quantities are plausible compared with the current total stock?
Out of that question I developed my own SAP- and Excel-based analysis, which made deviations more transparent early on and easier for stores to check in a targeted way.
A physical inventory does not start on inventory day.
During an inventory, different areas were recorded at different times.
The so-called low zone — the areas of the sales floor accessible to customers — was counted on the actual inventory day.
Stock in the high zones, on the other hand, could already be recorded by the stores in advance.
Depending on the store, this pre-count started at different times. That created a period between recording an article and the actual inventory day in which stock could continue to change through goods movements.
All the more reason to spot anomalies during preparation and to check the recorded quantities for plausibility.
When single rows do not tell the whole story.
System-side evaluations were already available for checking the pre-count.
While working with the data, however, I noticed a constellation that could make a quick overall assessment more difficult:
An article could have been recorded in several different counting zones. In the existing view, these entries appeared separately from one another.
For a robust assessment, though, it seemed essential to me not only to look at individual recording rows, but to compare the total recorded quantity of an article with the current total stock.
That is where the idea for an additional analysis came from.
From a single entry to the overall picture.
For my analysis I used data from SAP and then prepared it with my own Excel macro solution.
The aim was to combine the different pre-counts of an article and then compare them with the current total stock information.
This produced an overall view per article:
This information could then be viewed together and used for a targeted plausibility check.
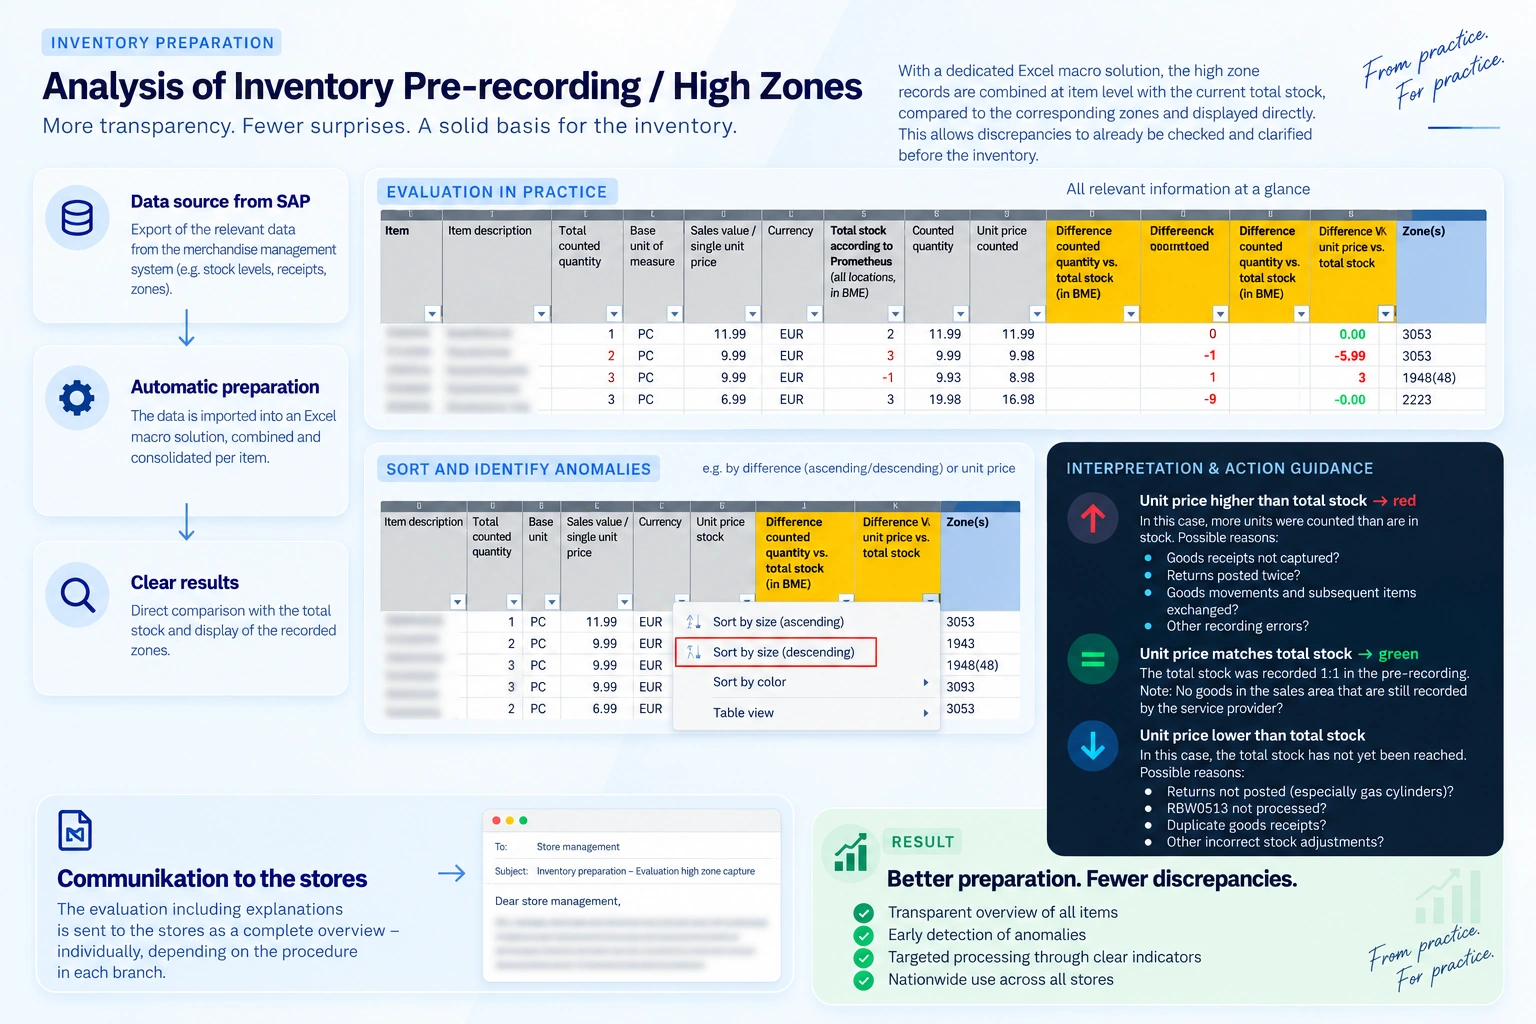
From the pre-count to the plausibility check: a simplified illustration of my SAP- and Excel-based analysis for spotting anomalies early.
How the analysis worked
- 1
Prepare the data basis
The information relevant for the analysis was provided from SAP and prepared in Excel for further processing.
- 2
Merge the counts
Several pre-counts of the same article were combined at article level so that the total recorded quantity could be reviewed.
- 3
Compare with total stock
The combined recorded quantity was compared with the current total stock and the resulting deviation was shown transparently.
- 4
Make counting zones visible
In addition, the counting zones in which the article had been recorded were shown. This made it easier to trace and check anomalies in a targeted way.
Numbers turn into pointers for checking.
A difference shows where you should look — not automatically why.
A deviation on its own does not yet explain its cause.
That is why it mattered to me not to provide the analysis merely as a list of figures. For different constellations I added notes on how the results could be interpreted and which possible causes could be considered during a further check.
Conspicuous differences could, for example, indicate that goods movements, entries or stock changes should be looked at more closely.
The analysis was not meant to automate a professional decision. It was meant to help users recognise relevant anomalies more quickly and then check them specifically.
Explaining data — not just delivering it.
Alongside the technical evaluation, I therefore also produced an understandable guide for the stores.
It explained different result situations and linked them with possible ways of checking.
For me that was an important part of the solution: an analysis only delivers its full value once the user understands what the information shown means and which next steps can follow from it.
In this way, the project connected data preparation, professional interpretation and knowledge transfer.
Recognise
Making conspicuous deviations visible during inventory preparation.
Understand
Putting results into context with comprehensible notes and possible ways of checking.
Act
Giving stores a basis for targeted further checks.
Not just sending out a file.
The evaluation was made available to the stores together with explanations.
My aim was not simply to send out yet another Excel file. Recipients should be able to follow how the results are to be read and in which constellations a closer check can make sense.
Depending on a store's situation and development, the analysis could be created again and provided in an updated form.
In this way, the technical evaluation became an instrument that combined analysis, communication and operational support.
Seeing earlier what could matter later.
The main benefit lay in not looking at anomalies only immediately before inventory day.
By comparing the pre-count with the current total stock, deviations could be made more transparent during inventory preparation and then checked in a targeted way.
As it was used further, my perception at the time was that differences from the pre-count could be reduced, because anomalies became visible and workable earlier.
For me that was a good example of how data analysis can help to accompany a process while it is still taking shape, instead of only checking it at the end.
Transparency
Comparing pre-counts and total stock at article level.
Early detection
Making anomalies visible while preparations are still running.
Prevention
Dealing with problems where possible before they create extra work on inventory day.
From my own analysis to use in the stores.
The solution grew during 2025 out of my work on inventory preparation and was then made available to the stores for practical use.
The combination of article-level consolidation, stock comparison, display of the counting zones and additional checking aids turned the evaluation into an extra working basis for inventory preparation.
What mattered particularly to me was that it did not just deliver data, but also supported an understanding of how to interpret it.
For me, good analysis starts with the right question.
In this project, the starting point for me was not Excel, but a professional observation.
I wanted to understand why an existing view did not always offer the transparency I wanted for practical work on a particular question.
Only then did the technical solution follow.
That order still matters to me today:
Not first considering which tool you could use — but understanding which problem actually needs solving.
Once the question is clear, data and technology can help to develop a workable solution from it.
The tool does not come first. The right question does.
More case studies