Shrinkage & Root Cause Analysis
Behind every KPI there is a cause.
From deviation to concrete action.
Shrinkage is first of all a KPI. What really matters is the question of what caused a conspicuous development in the first place.
My work therefore never stopped at looking at figures. It was about connecting different sources of information: inventory results, inventory corrections, write-offs, shrinkage, operational observations and insights from the stores.
The goal was to narrow down anomalies systematically, identify possible root causes and derive concrete fields of action for day-to-day operations.
This resulted in an approach that combined data analysis, store observation, process review and close exchange with everyone involved.
From a KPI to the right question
A conspicuous KPI only shows that a deviation exists. It does not yet explain why that deviation came about.
With shrinkage in particular, several factors can interact — for example inventory management, inventory processes, goods movements, organisational workflows or specific product and assortment areas.
That is why I never looked at KPIs in isolation, but treated them as the starting point for a deeper root cause analysis.
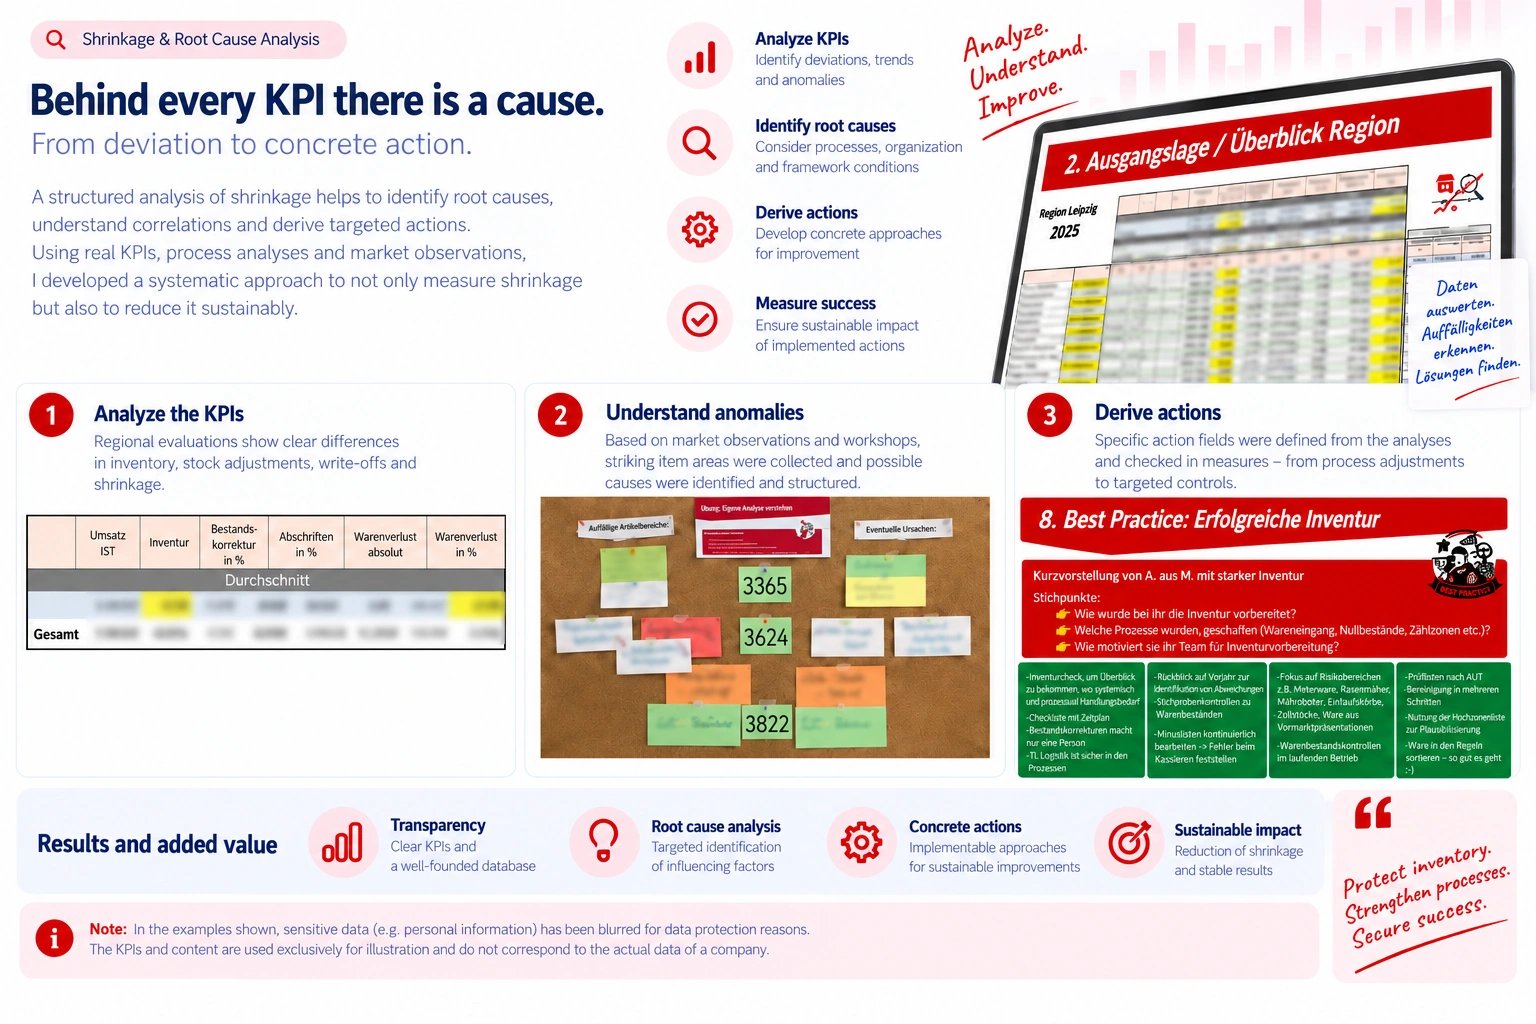
Overview of the approach: analysing KPIs, understanding anomalies, identifying root causes and deriving actions. Sensitive data has deliberately been made unreadable.
My approach
- 1
Analyze the KPIs
Regional evaluations and further KPIs were used to make deviations, trends and unusual developments visible. Among other things, this covered inventory results, inventory corrections, write-offs and shrinkage.
- 2
Understand anomalies
The next step was to look at conspicuous areas in more detail. Store observations, operational experience and workshops helped to collect possible influencing factors, recognise correlations and structure the right questions.
- 3
Identify root causes
KPIs and observations were combined. Instead of jumping to conclusions about single causes, processes, organisation, stock, inventory topics and other operational conditions were considered together.
- 4
Derive actions and measure impact
The findings were translated into concrete fields of action and measures — for example process adjustments, targeted checks or stronger awareness of specific risk areas. It was then essential to monitor how the KPIs developed further and to review whether the measures actually had an effect.
Analysis does not end in Excel.
For me, an evaluation only creates real value once it leads to comprehensible courses of action for day-to-day operations.
Exchange with the stores was therefore part of the approach. Conspicuous product areas and possible causes could be reviewed together and worked through in a structured way.
At the same time, insights from successful practices could be used to make workable approaches visible for other stores as well.
This created a link between data analysis, operational experience, root cause analysis and concrete process improvement.
Results & added value
Transparency
Clear KPIs and a structured data basis.
Root cause analysis
Systematic identification of influencing factors and correlations.
Concrete actions
Turning analytical findings into practical actions.
Sustainable impact
Monitoring developments and evaluating the impact of implemented actions.
The KPI is not the solution — the understanding behind it is.
Working with shrinkage has strongly shaped the way I look at KPIs.
A figure can make a need for action visible. But to turn it into a sound decision, data, processes and operational reality have to be considered together.
Exactly this combination of analysis, understanding of causes and practical implementation remains an important part of the way I work today.
Focus areas
More case studies