Data analysis & automation
Up to 100,000 rows become one working basis.
The 41 weekly report regularly provided stores with an extensive set of data on the listed articles. Depending on its scope, the Excel file could contain up to around 100,000 rows with numerous key figures. For me, the challenge was therefore not to supply even more data — but to make the existing information usable for operational work more quickly and more precisely.
Plenty of data. Plenty of options. But little time.
The 41 weekly report contained a wide range of information and key figures on the listed articles — including stock levels, suppliers, merchandise areas, module assignments and other operational attributes.
For the managers in the stores this meant: the information they needed was fundamentally available. With a file of sometimes up to around 100,000 rows, however, the real challenge was to quickly filter out the relevant articles and key figures for a specific question.
That is exactly where the idea for my own evaluation file came from.
Not more data. Just a faster route to the relevant information.
I developed my own Excel macro file into which the complete 41 weekly report could be imported. The aim was to prepare recurring analyses and filters so that users did not have to process an extensive raw data file manually every time.
Using an interface I built, different evaluations could then be started directly and targeted working lists generated from the large data basis.
I continued to develop the solution over a longer period and added further functions to it.
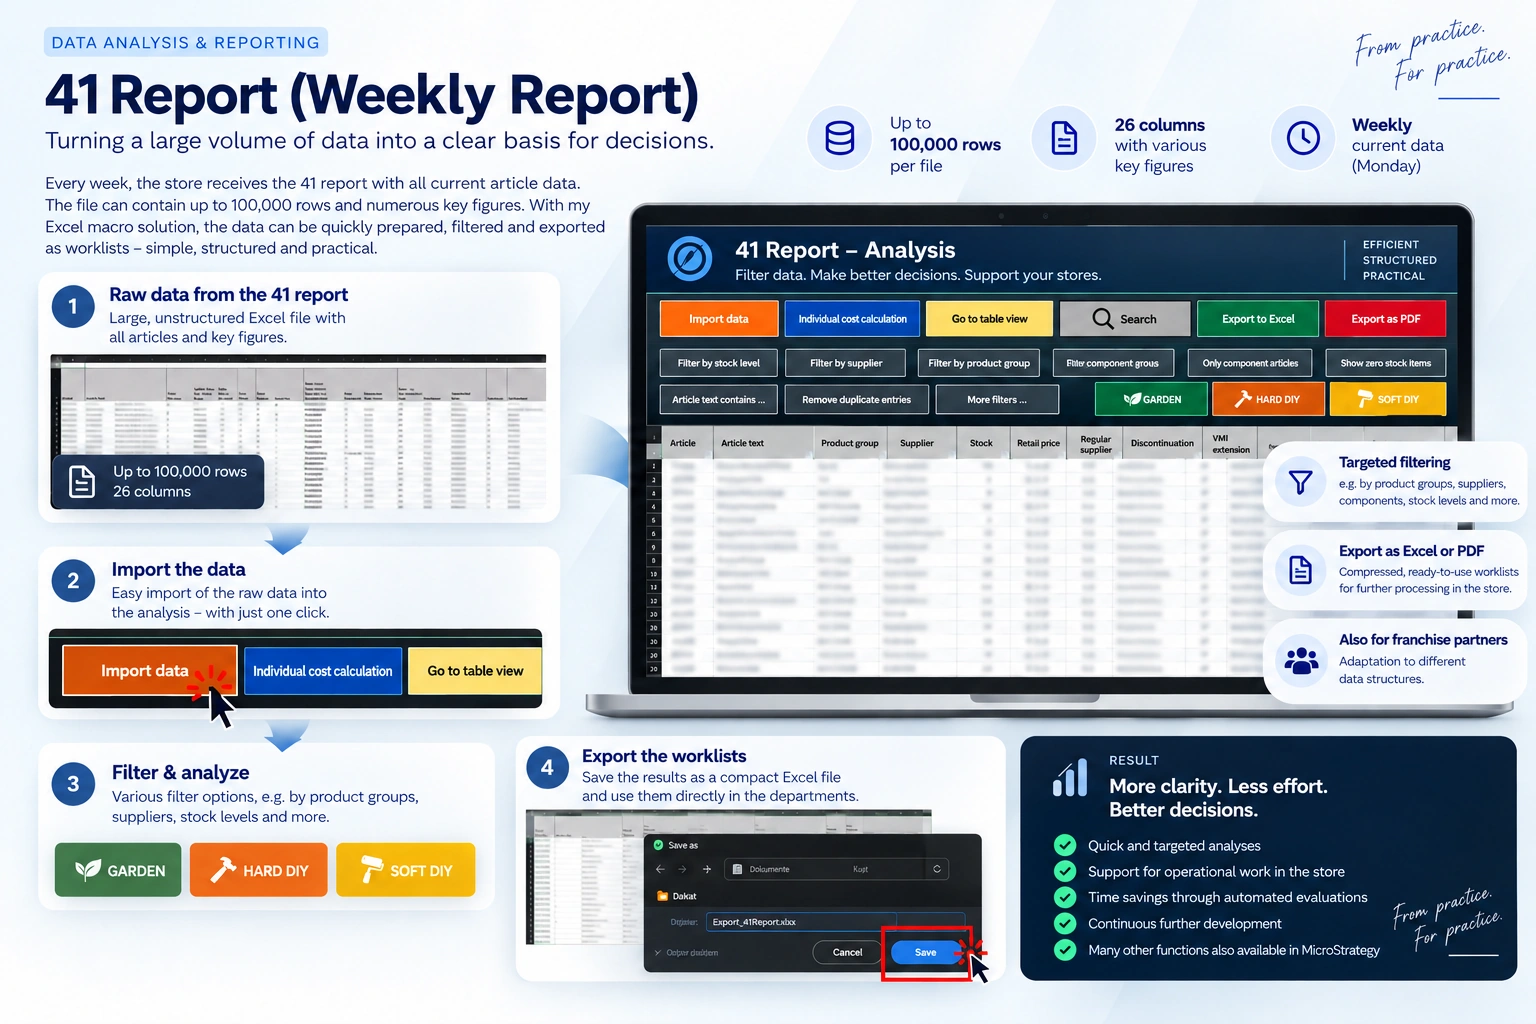
From an extensive set of raw data to a targeted working list: a simplified illustration of the analysis workflow I developed.
How the solution worked
- 1
Import the raw data
The complete 41 weekly report was imported into the prepared evaluation file.
- 2
Analyse in a targeted way
Predefined functions allowed different filters and evaluations without having to rework the large raw data file manually every time.
- 3
Structure for operations
Among other things, data could be structured along the company's categories Garden, Hard DIY and Soft DIY and then analysed further.
- 4
Generate working lists
The results needed in each case could be exported as a new Excel file or as a PDF. This produced compact working lists that could, for example, be used directly for further processing in the respective areas.
A solution that grew with the requirements.
The file was never a one-off project for me. In practical use, new requirements and ideas kept coming up, which I then integrated into the solution.
Besides additional filter and evaluation options, the application was later also adapted for partner retailers. Their 41 weekly report had a different data structure, so the solution had to be extended accordingly.
Over time, what started as a working aid grew into a more comprehensive analysis tool for a range of operational questions.
Data turns into concrete steps of work.
For me, the value of the solution lay above all in bringing a very extensive data basis closer to the operational work in the store.
Instead of starting again with the complete raw data file for every question, relevant information could be filtered out specifically and output as a manageable working basis.
In this way, the solution connected data analysis with everyday store work — exactly where the information was ultimately needed.
Structure
Reducing large volumes of data to the relevant information.
Efficiency
Preparing and simplifying recurring analyses and filters.
Practice
Turning analyses into concrete working lists for day-to-day processing.
From an Excel tool to web-based analysis
At the end of 2025 and the start of 2026, the 41 weekly report also became available within a web-based MicroStrategy analysis environment. Many of the filter and evaluation options I had previously considered useful and implemented in my Excel solution later became available there as well.
Why this project means something to me.
The 41 weekly report is one of the solutions I look back on with particular pleasure. Not because of the size of the Excel file or the number of functions, but because the way it developed was very typical of how I work:
Recognising a challenge from day-to-day operations, understanding the available data, developing my own solution and improving it step by step as new requirements came up.
For me, the project therefore shows particularly well how I understand digitalisation: technology is valuable when it genuinely helps people in their daily work.
More case studies